Filter
RSS

Blog

Technical Analysis of JUBLFOOD & HDFCLIFE

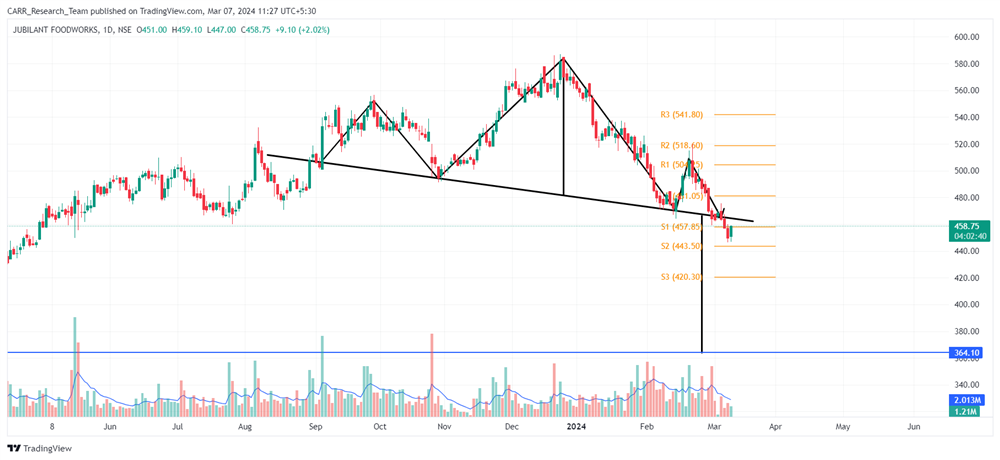
Stock name: Jubilant Foodworks Ltd.

Pattern: Head and shoulders pattern and retest

Time frame: Daily

Observation:

The stock exhibited a positive trend since March 2023. From September 2023 to February 2024, it has formed a head and shoulder pattern on the daily chart. A breakout occurred on February 29, 2024, accompanied by significant trading volume and a bearish MACD indicator. Following the breakout, the stock underwent an initial retest of levels, and currently, it is on a downward trajectory with a low RSI. Based on technical analysis, the stock might continue its descent if the current momentum persists.

You may add this to your watch list to understand further price action.

Disclaimer: This analysis is purely for educational purpose and does not contain any recommendation. Please consult your financial advisor before taking any financial decision.

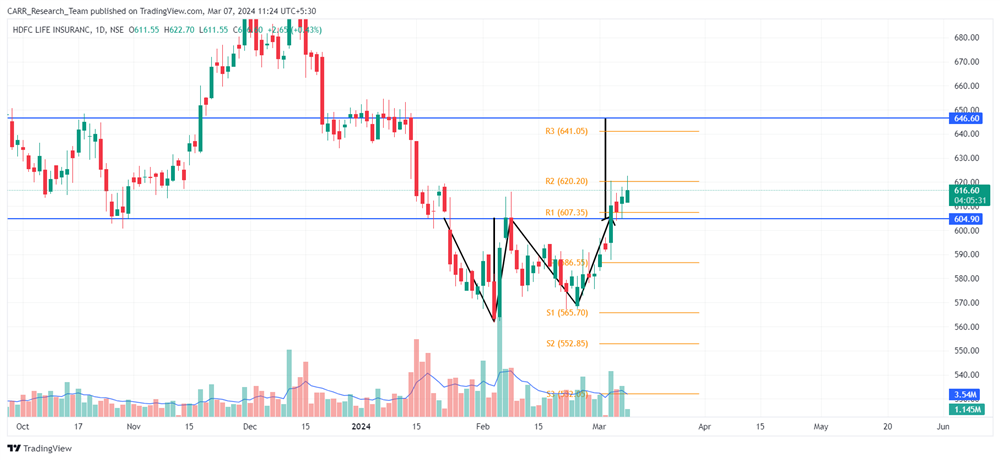
Stock name: HDFC Life Insurance Company Ltd.

Pattern: Double bottom pattern

Time frame: Daily

Observation:

Since December 2023, the stock has been experiencing a decline. However, between January 23, 2024, and March 04, 2024, it stabilized and established a double bottom pattern on its daily chart. A breakout from this pattern occurred on March 04, 2024, accompanied by substantial trading volume. The RSI levels of the stock are also in a favourable range. According to technical analysis, if the stock sustains the breakout momentum, it may see an upward movement.

You may add this to your watch list to understand further price action.

Disclaimer: This analysis is purely for educational purpose and does not contain any recommendation. Please consult your financial advisor before taking any financial decision.


News for the day:

  • Mahindra & Mahindra's promoter group entity, Prudential Management and Services Pvt Ltd (PMSL), is selling shares through Kotak Securities to address specific liquidity needs. The sale will decrease PMSL's holding and reduce the overall promoters' stake in the company from 19.32% to 18.57%. The move aims to meet the family's liquidity requirements, as clarified by the company in response to news reports on the share sale.

  • IIFL Finance is securing a $200 million liquidity boost from top shareholder Fairfax India after the RBI banned its gold loan disbursals, causing liquidity concerns. Fairfax India, holding 15%, expresses confidence in IIFL's management. The RBI's directive led to a 36% share price drop, prompting the liquidity support. IIFL Finance is committed to compliance, with the RBI set to review after a special audit and rectifications.

  • Indian Oil Corporation (IOC) plans to be the first Indian company to produce Formula One (F1) fuel, with 'Storm - Ultimate Racing Fuel' unveiled for the FIM Asia Road Racing Championship. IOC aims to manufacture F1-grade fuel within three months, expressing ambitions to enter the high-performance racing sector. The specialized fuel meets FIM Category 2 race fuel requirements and emphasizes IOC's interest in providing for F1 teams with flexible fuel supplier options.
Technical Analysis of JUBLFOOD & HDFCLIFE
Read More
Technical Analysis of JKLAKSHMI & JINDALSTEL

Stock name: JK Lakshmi Cement Ltd.

Pattern: Cup and handle pattern and retest

Time frame: Daily

Observation:

Between December 2022 and January 2024, the stock exhibited a cup and handle pattern on its daily chart. A notable breakout occurred on January 25, 2024, marked by significant trading volume and a positive MACD indicator. Subsequently, the stock underwent a substantial retest of the breakout levels. Presently, the stock's RSI level hovers just below 50. Technical analysis suggests that a rebound from the retest may propel the stock in an upward direction.

You may add this to your watch list to understand further price action.

Disclaimer: This analysis is purely for educational purpose and does not contain any recommendation. Please consult your financial advisor before taking any financial decision.

Stock name: Jindal Steel & Power Ltd.

Pattern: Rounding bottom pattern

Time frame: Monthly

Observation:

Since 2010, the stock experienced a decline, but from September 2015 onwards, it initiated a recovery, moving upward. Recently, it reached its 2010 levels and formed a rounding bottom pattern on the monthly chart from April 2010 to December 2023. December 2023 witnessed a breakout from this pattern. Post breakout the stock has continued its upward movement. According to technical analysis, maintaining the current momentum may propel the stock further upward.

You may add this to your watch list to understand further price action.

Disclaimer: This analysis is purely for educational purpose and does not contain any recommendation. Please consult your financial advisor before taking any financial decision.


News for the day:

  • Zomato shares dipped 3.6% on BSE after Ant Financial, an Alibaba affiliate, sold a 2% stake at a 5% discount in a block deal worth over Rs 3,000 crore. This move led to a CLSA target price revision. Zomato reported a quarterly net profit of Rs 138 crore, showing a 69% increase in revenue. Ant Financial held a 6.32% stake in Zomato as of December, making the recent sell-off a notable development.

  • RBI has prohibited JM Financial Products from engaging in share and bond funding, citing regulatory lapses and governance violations. The directive includes a halt to financing against shares and debentures, including loans against IPOs and subscription to debentures. Despite the regulator's claims, JM Financial Products has refuted allegations of lapses and violations. The Reserve Bank of India's stern letter on Tuesday emphasized the immediate cessation of such financial activities by the company.

  • The Reserve Bank of India (RBI) has imposed immediate restrictions on IIFL Finance, preventing the disbursal of gold loans. Following this announcement, IIFL Finance's shares were locked in a 20% lower circuit. The RBI's directive prohibits the company from issuing new gold loans or disbursing funds against existing ones. This development has significantly impacted IIFL Finance's market performance, prompting a notable decrease in its share value.
Technical Analysis of JKLAKSHMI & JINDALSTEL
Read More
Technical Analysis of CERA & PCBL

Stock name: Cera Sanitaryware Ltd.

Pattern: Head and shoulders pattern

Time frame: Weekly

Observation:

The stock has generally exhibited a positive trend, but between May 2023 and February 2024, it formed a head and shoulder pattern on the weekly chart. In February 2024, there was a breakout from this pattern, accompanied by higher-than-average trading volume. Subsequently, the stock experienced a downward movement. Presently, the stock's RSI is at low levels. Based on technical analysis, the stock might continue its downward trajectory if the current momentum is sustained.

You may add this to your watch list to understand further price action.

Disclaimer: This analysis is purely for educational purpose and does not contain any recommendation. Please consult your financial advisor before taking any financial decision.

Stock name: PCBL Ltd.

Pattern: Double top pattern

Time frame: Daily

Observation:

Post covid pandemic, the stock has consistently shown an upward trajectory. However, between January and February 2024, a double top pattern emerged on its daily chart. A breakout from this pattern occurred with above-average trading volume. Following the breakout, the stock underwent a successful retest and is presently moving downward. Additionally, the stock's RSI levels are currently low. Technical analysis suggests that the stock may continue its descent if the existing momentum persists.

You may add this to your watch list to understand further price action.

Disclaimer: This analysis is purely for educational purpose and does not contain any recommendation. Please consult your financial advisor before taking any financial decision.


News for the day:

  • The RBI has approved the merger of Fincare Small Finance Bank with AU Small Finance Bank, marking the first-ever such merger in the small finance banking sector. Shareholders of Fincare will receive 579 equity shares of AU for every 2,000 shares held. This move grants AU a strategic foothold in southern India and entry into microfinance, resulting in a combined network of 2,334 branches.

  • Tata Motors has announced its decision to split into two listed entities, separating its commercial vehicle business and related investments from the passenger vehicle business, which includes Jaguar Land Rover (JLR), electric vehicles, and associated investments. The split is based on the recognition of limited synergies between the two segments, with each entity poised to operate independently.

  • Bharat Heavy Electricals (Bhel) shares surged 12.4% on news of a potential ₹17,000 crore thermal plant order, the largest single-day gain since May 2021. Bhel clarified it has not yet received the order from NTPC. Bhel is the sole bidder for the NTPC tender submitted on December 21, 2023.
Technical Analysis of CERA & PCBL
Read More
Technical Analysis of LALPATHLAB & JUSTDIAL

Stock name: Dr. Lal Path Labs Ltd.

Pattern: Head and shoulders pattern

Time frame: Daily

Observation:

Since March 2023, the stock displayed an upward trend. From September 2023 to February 2024, it stabilized and formed a head and shoulder pattern on the daily chart. The breakout from this pattern occurred on February 27, 2024, with above-average trading volume and a bearish MACD indicator. Following the breakout, the stock has been moving downward, accompanied by low RSI levels. Technical analysis suggests that if the current momentum persists, the stock may continue its downward trajectory.

You may add this to your watch list to understand further price action.

Disclaimer: This analysis is purely for educational purpose and does not contain any recommendation. Please consult your financial advisor before taking any financial decision.

Stock name: Justdial Ltd.

Pattern: Cup and handle pattern

Time frame: Daily

Observation:

Sustaining its upward trend, the stock formed a cup and handle pattern from July 2023 to February 2024. A breakout from this pattern occurred on February 23, 2024, backed by above-average trading volume. Following the breakout, the stock underwent a substantial retest of the breakout level and currently it is still hovering slightly above it. According to technical analysis, a successful rebound from the retest may indicate further upward movement for the stock.

You may add this to your watch list to understand further price action.

Disclaimer: This analysis is purely for educational purpose and does not contain any recommendation. Please consult your financial advisor before taking any financial decision.


News for the day:

  • Aditya Birla Group has received approval from the National Company Law Tribunal (NCLT) to merge several of its non-banking finance companies (NBFCs) as part of a consolidation plan. The move aims to enhance synergies, optimize resource utilization, and achieve greater economies of scale. The Mumbai bench of the NCLT has recently greenlit the merger of six Birla group entities, including Umang Commercial Company Pvt Ltd and Aditya Birla Online Fashion Pvt Ltd, into Birla Group Holdings Pvt Ltd (BGHPL), a pivotal holding company within the conglomerate.

  • In February, TVS Motor Company experienced a robust sales performance, witnessing a 33% YoY increase in wholesales to 368,424 units, compared to 276,150 units in the same period last year. Total two-wheeler sales exhibited a growth of 34%, reaching 357,810 units from 267,026 units in February 2023. Furthermore, the company reported a 16% rise in electric vehicle sales, reaching 17,959 units in February compared to 15,522 units in the corresponding month of the previous year.

  • Signature Global has successfully sold 1,008 luxury flats in Gurugram for over Rs 3,600 crore, reflecting strong demand despite price increases. The new housing project, 'DE LUXE-DXP,' received 5,400 Expressions of Interest, with 35% of units booked by Non-Resident Indians and senior corporate executives. The company's sales bookings for the fiscal year are now projected to surpass Rs 7,200 crore, exceeding initial estimates of Rs 4,500 crore.
Technical Analysis of LALPATHLAB & JUSTDIAL
Read More
What is MACD..?

With the increasing participation in the stock market, we are constantly in need of tools and indicators to help them make informed decisions. One such tool that is recognised to be significant popularity and useful among traders is the MACD. This versatile tool, developed in the late 1970s, continues to be a mainstay for traders seeking to understand price trends and identify potential entry and exit points. But what exactly is the MACD, and how can you leverage its insights for informed trading decisions?

Decoding the MACD Calculation:

The MACD isn't a single line but rather a combination of three components:

  • MACD Line: This represents the difference between two exponential moving averages (EMAs) of the closing price. Typically, a 12-period EMA and a 26-period EMA are used.
  • Signal Line: This is a 9-period EMA of the MACD line itself, acting as a smoother filter for identifying potential trend changes.
  • MACD Histogram: This visualizes the difference between the MACD line and the signal line, offering insights into momentum.

Interpreting MACD Signals

While the calculation might seem complex, the interpretation boils down to observing key interactions:

  • Crossovers: When the MACD line crosses above the signal line, it's often interpreted as a bullish signal, suggesting potential upward momentum. Conversely, a downward crossover might indicate a bearish trend.
  • Divergence: When the price movement diverges from the direction of the MACD, it can signal a potential reversal. Bullish divergence occurs when price dips but the MACD rises, suggesting buying pressure. Bearish divergence happens when price rises but the MACD falls, hinting at possible selling pressure.
  • Histogram: The bars of the histogram provide a visual representation of momentum. Expanding bars suggest increasing momentum, while shrinking bars indicate weakening momentum.

The Limitations of the MACD

While the MACD offers valuable insights, it's crucial to remember it's not a foolproof system:

  • Lag: As the MACD is based on moving averages, it inherently lags behind price action. This means it might not capture sudden shifts in the market.
  • False Signals: Crossovers and divergences don't guarantee future price movements. Always combine the MACD with other technical indicators and fundamental analysis for confirmation.
  • Overbought/Oversold: The MACD is not designed to identify overbought or oversold conditions. Utilize other indicators like the Relative Strength Index (RSI) for this purpose.

Conclusion

The MACD, like any technical tool, is best used in conjunction with a comprehensive trading strategy. By understanding its calculation, interpreting its signals, and acknowledging its limitations, you can unlock its potential to gain valuable insights into market trends and make informed trading decisions. Remember, the key to success lies not in relying solely on any single indicator, but in utilizing a combination of tools and your own sound judgment. So, dive deeper, experiment, and trade with confidence!

If you love to understand the technical analysis that goes behind understanding the time of entry and exit, make sure to check out my course on Technical Analysis. Until next time!

What is MACD..?
Read More
Technical Analysis of EMAMILTD & NMDC

Stock name: Emami Ltd.

Pattern: Double top pattern

Time frame: Daily

Observation:

Starting March 2023, the stock displayed an upward trend, stabilizing from August 2023 and forming a double top pattern on the daily chart between August 2023 and February 2024. A breakout from this pattern occurred on February 8, 2024, leading to a subsequent downward movement. The stock's RSI is currently at a notably low level. Technical analysis suggests that if the stock maintains this momentum, it may experience further downward movement.

You may add this to your watch list to understand further price action.

Disclaimer: This analysis is purely for educational purpose and does not contain any recommendation. Please consult your financial advisor before taking any financial decision.

Stock name: NMDC Ltd.

Pattern: Rounding bottom pattern

Time frame: Monthly

Observation:

Since January 2010, the stock has experienced a downward trend, followed by a stabilizing phase over an extended period, showing signs of improvement only recently. It has successfully reached its March-April 2011 levels and exhibited a rounding bottom pattern between March 2011 and January 2024, culminating in a breakout in January 2024. This breakout was accompanied by above-average trading volume. However, caution is warranted as the stock is currently in an overbought state according to the RSI, and a bearish pattern has formed on its daily chart, suggesting a potential retest of the breakout levels. Despite these challenges, according to technical analysis, maintaining the breakout momentum may lead to further upward movement.

You may add this to your watch list to understand further price action.

Disclaimer: This analysis is purely for educational purpose and does not contain any recommendation. Please consult your financial advisor before taking any financial decision.


News for the day:

  • Paytm Payments Bank and Paytm are discontinuing inter-company agreements in response to regulatory scrutiny, with Paytm Payments Bank instructed by the Reserve Bank of India to halt basic banking services from March 16. Founder Vijay Shekhar Sharma resigned from the Payments Bank's board, and Paytm aims to strengthen independent operations amid ongoing regulatory actions, including SoftBank reducing its stake in Paytm to 2.83%.

  • The merger of Reliance Industries Ltd (RIL) subsidiary Viacom18 and The Walt Disney Company’s local unit Star India, with a total valuation of Rs 70,352 crore ($8.5 billion), is set to establish the largest media entity in India. With Reliance Industries infusing Rs 11,500 crore, the combined entity is expected to command over 40% viewership share, enabling it to secure premium advertising rates and high consumer average revenue per user (ARPU). The failure of the Zee Entertainment Enterprises and Sony Pictures Networks India merger is seen as advantageous for Star-Viacom18, preventing a potential duopoly in the market.

  • The Indian government has increased the windfall tax on petroleum crude from Rs 3,300 to Rs 4,600 per metric ton, effective March 1, as per a government order. Simultaneously, the windfall tax on diesel has been reduced to zero from Rs 1.50 per litre, while the taxes on petrol and aviation turbine fuel remain unchanged at nil. The windfall tax was initially imposed on crude oil producers in July 2022 and has since been regularly revised by the government.
Technical Analysis of EMAMILTD & NMDC
Read More
Technical Analysis of HEG & KANSAINER

Stock name: H.E.G. Ltd.

Pattern: Double top pattern

Time frame: Daily

Observation:

The stock displayed an upward trend from April 2023, followed by a stabilization period and the formation of a double top pattern from December 2023 to February 2024. The breakout from the double top pattern on February 13, 2024, was accompanied by average trading volume and a bearish MACD signal. Despite a retest of levels, the stock experienced a subsequent downward movement. Currently the RSI of the stock is also at an unfavourable level. According to technical analysis, if the current momentum persists, the stock may continue its downward trajectory.

You may add this to your watch list to understand further price action.

Disclaimer: This analysis is purely for educational purpose and does not contain any recommendation. Please consult your financial advisor before taking any financial decision.

Stock name: Kansai Nerolac Paints Ltd.

Pattern: Double top pattern

Time frame: Weekly

Observation:

Experiencing an upward trend since April 2023, the stock underwent a stabilization phase and formed a double top pattern from June 2023 to February 2024 on the weekly chart. A breakout occurred in February 2024, supported by average trading volume. Subsequently, the stock shifted in a downward direction, and as per technical analysis, it may sustain this downward trajectory if the current momentum persists.

You may add this to your watch list to understand further price action.

Disclaimer: This analysis is purely for educational purpose and does not contain any recommendation. Please consult your financial advisor before taking any financial decision.


News for the day:

  • IndiGo has unveiled expansion plans with six new domestic routes starting March 31, 2024, including direct flights like Ahmedabad-Rajkot and Kolkata-Srinagar. The move aims to meet increasing travel demand, positioning the airline strategically in the competitive aviation market.

  • Reliance Industries has entered into a strategic partnership with Sri Lanka-based Elephant House, a prominent beverage maker. The collaboration aims to expand Reliance's footprint in the fast-moving consumer goods (FMCG) sector, marking a significant move in strengthening its presence in the international market.

  • Tata Group is set to unveil a semiconductor manufacturing unit soon. N. Chandrasekaran, the Chairman of Tata Sons, confirmed the impending announcement, signalling Tata's entry into the electronics and semiconductor industry.
Technical Analysis of HEG & KANSAINER
Read More
Technical Analysis of YESBANK & INFIBEAM

Stock name: Yes Bank Ltd.

Pattern: Cup and handle pattern and retest

Time frame: Daily

Observation:

Between December 2022 and February 2024, the stock displayed a cup and handle pattern on its daily chart. On February 7, 2024, the stock experienced a breakout from this pattern, accompanied by substantial trading volume and a positive MACD indicator signal. Following the breakout, the stock trended upward, but it is currently undergoing a significant retest and has closed below the breakout level. Both the RSI and MACD indicators are in the bearish zone, suggesting a potential downturn. According to technical analysis, a substantial rebound and positive momentum are crucial for the stock to move upward.

You may add this to your watch list to understand further price action.

Disclaimer: This analysis is purely for educational purpose and does not contain any recommendation. Please consult your financial advisor before taking any financial decision.

Stock name: Infibeam Avenues Ltd.

Pattern: Double bottom pattern and retest

Time frame: Weekly

Observation:

Experiencing a significant decline since September 2018, the stock recently formed a double bottom pattern on its weekly chart. It has registered a breakout out in January 2024 with average trading volume support. Subsequent to the breakout, the stock trended upward, but it is presently undergoing a retest. The stock's RSI is in the overbought zone, suggesting a potential correction. According to technical analysis, a successful rebound from the retest may propel the stock further upward.

You may add this to your watch list to understand further price action.

Disclaimer: This analysis is purely for educational purpose and does not contain any recommendation. Please consult your financial advisor before taking any financial decision.


News for the day:

  • Maruti Suzuki has formed a partnership with Union Bank of India to offer dealer financing solutions. The collaboration aims to enhance the accessibility of financing options for Maruti Suzuki dealers, facilitating smoother operations and promoting growth in the auto industry. This strategic alliance is expected to strengthen the financial support system for dealers, potentially contributing to increased vehicle sales and market expansion for Maruti Suzuki in India.

  • Patanjali Foods reassures that the recent Supreme Court observations on advertisements by the promoter group will not impact its business operations. The company responds confidently, asserting that its day-to-day functions will continue unaffected by the court's remarks on promotional activities.

  • DCM Shriram is set to invest Rs 1,000 crore in a greenfield epoxy resin plant over the next few years. The industrial conglomerate aims to expand its footprint in the chemicals and fertilizers sector with this substantial investment. The new plant is expected to bolster DCM Shriram's production capabilities, contributing to its strategic growth plans in the chemical industry.
Technical Analysis of YESBANK & INFIBEAM
Read More
Technical Analysis of MAHABANK & CENTRALBK

Stock name: Bank of Maharashtra

Pattern: Rounding bottom pattern

Time frame: Monthly

Observation:

Since January 2008, the stock has been on a downward trajectory, with a notable recovery post-COVID. Presently, it has reached levels last seen in 2014 and formed a rounding bottom pattern on its monthly chart from July 2014 to January 2024. The breakout from this pattern occurred in January 2024, supported by above-average trading volume. The current overbought RSI suggests a potential retest. According to technical analysis, the stock may experience further upward movement if it maintains its current momentum.

You may add this to your watch list to understand further price action.

Disclaimer: This analysis is purely for educational purpose and does not contain any recommendation. Please consult your financial advisor before taking any financial decision.

Stock name: Central Bank of India

Pattern: Cup and handle pattern and retest

Time frame: Weekly

Observation:

Since May 2017, the stock has exhibited a consistent decline. Notably, from September 2018 to January 2024, it underwent the formation of a cup and handle pattern on its weekly chart, culminating in a breakout in January 2024. This breakout was accompanied by above-average trading volume and a positive MACD indicator signal. Subsequent to the breakout, the stock initiated an upward movement, although it is presently undergoing a retest phase. The RSI currently resides in the overbought zone, suggesting a potential cooldown. Technical analysis suggests that a successful rebound from the retest and the establishment of upward momentum may move the stock in an upward trajectory.

You may add this to your watch list to understand further price action.

Disclaimer: This analysis is purely for educational purpose and does not contain any recommendation. Please consult your financial advisor before taking any financial decision.


News for the day:

  • GIFT City, India's international financial center, is seeking approval from the Reserve Bank of India (RBI) to establish a Real-Time Gross Settlement (RTGS)-like system for dollar payments. This move aims to enhance efficiency in dollar transactions within the Gift City ecosystem. The proposed system is expected to streamline and expedite dollar transactions, promoting a more seamless financial environment.

  • The Reserve Bank of India (RBI) has imposed fines totalling nearly Rs 3 crore on State Bank of India (SBI), Canara Bank, and City Union Bank. The penalties were levied for non-compliance with various regulatory guidelines and norms. SBI faced fines for deficiencies in regulatory compliance, while Canara Bank and City Union Bank were penalized for lapses in the area of cybersecurity and fraud risk management.

  • Reliance Industries and Disney reportedly may announce a merger between their media subsidiaries, Star India and Viacom18, this week. This strategic move aims to create a powerhouse in the Indian media and entertainment industry. The merged entity is expected to combine a diverse range of content and broadcasting assets, potentially reshaping the dynamics of the sector.
Technical Analysis of MAHABANK & CENTRALBK
Read More